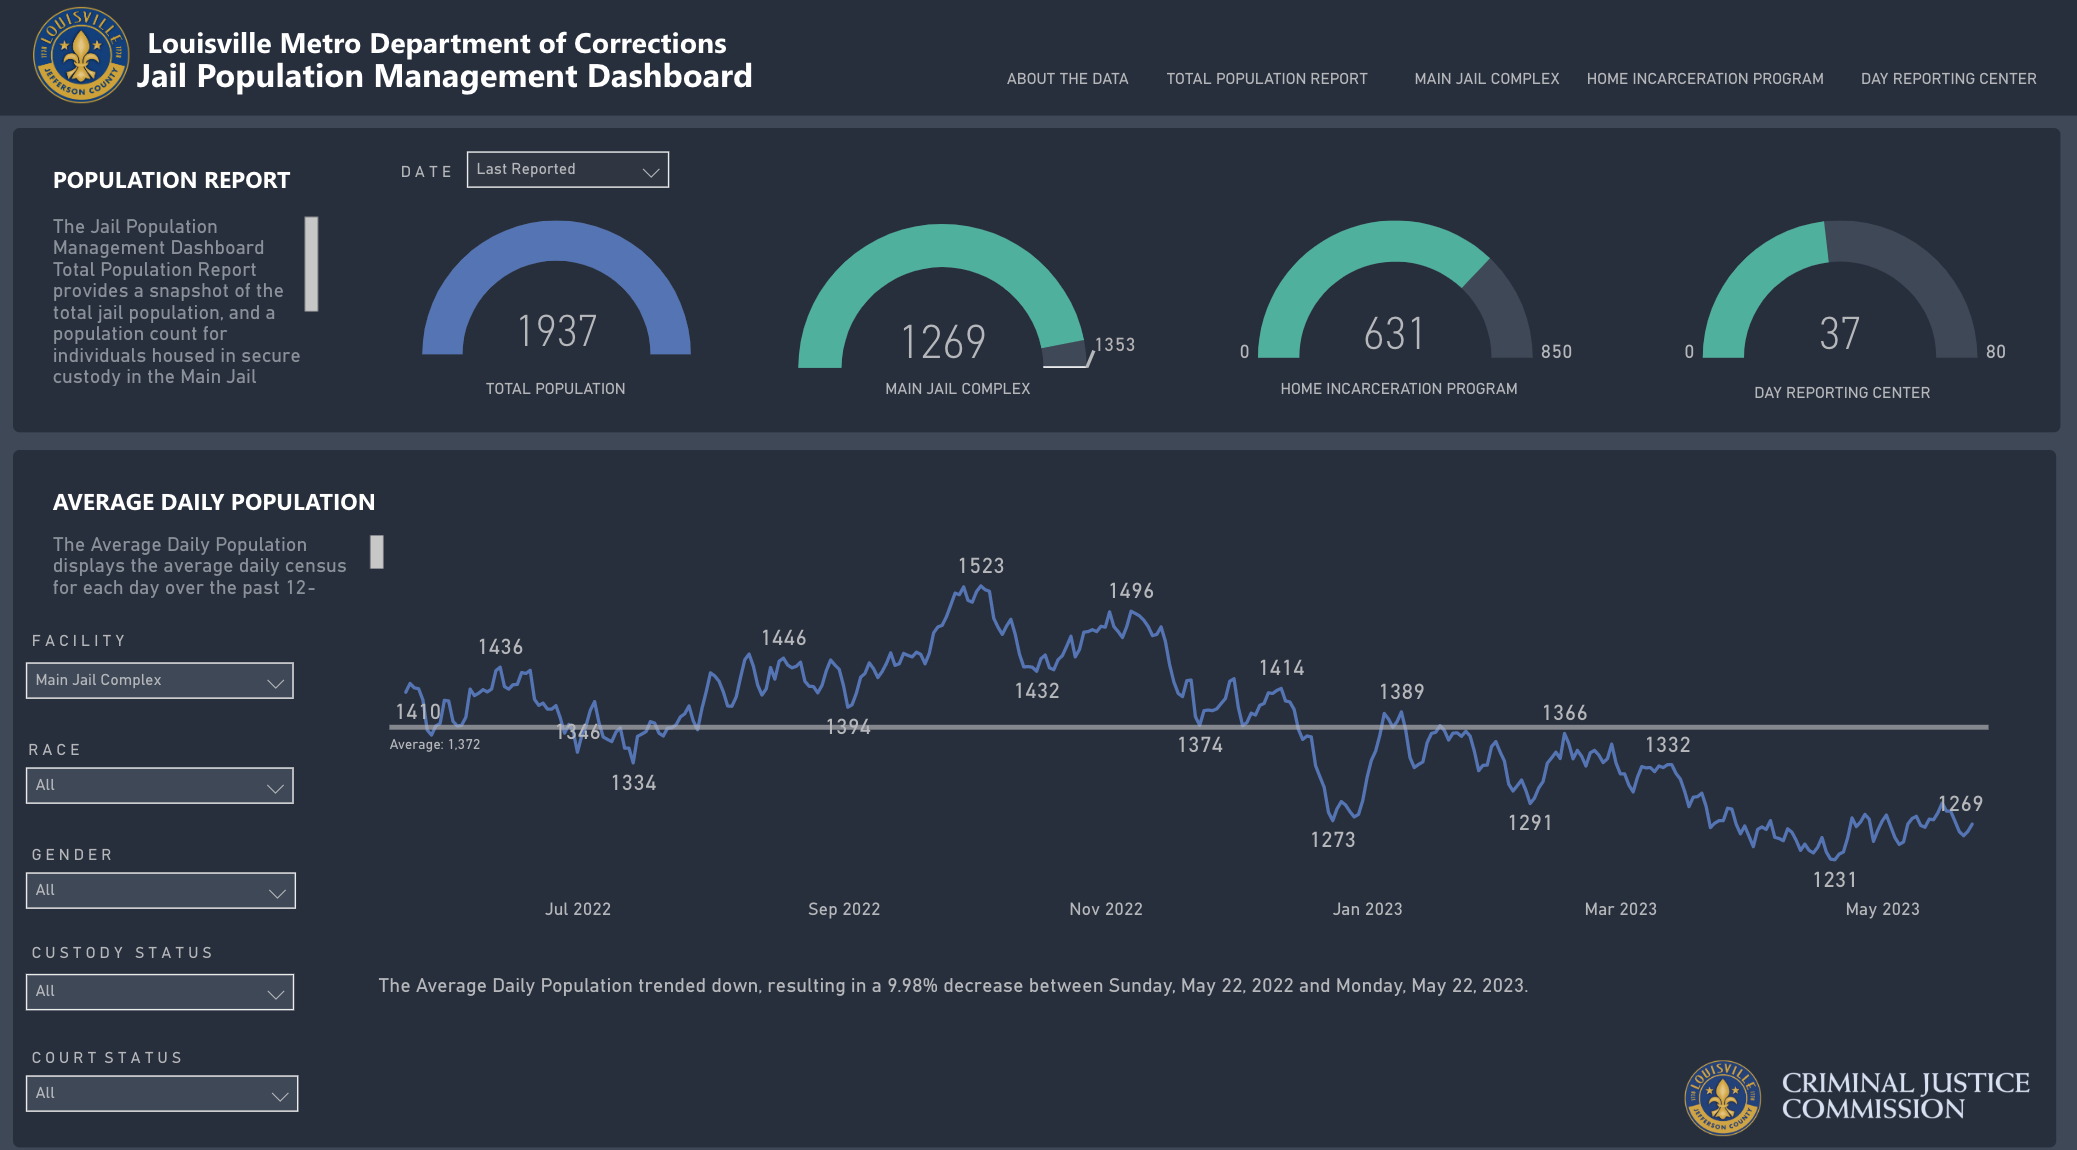
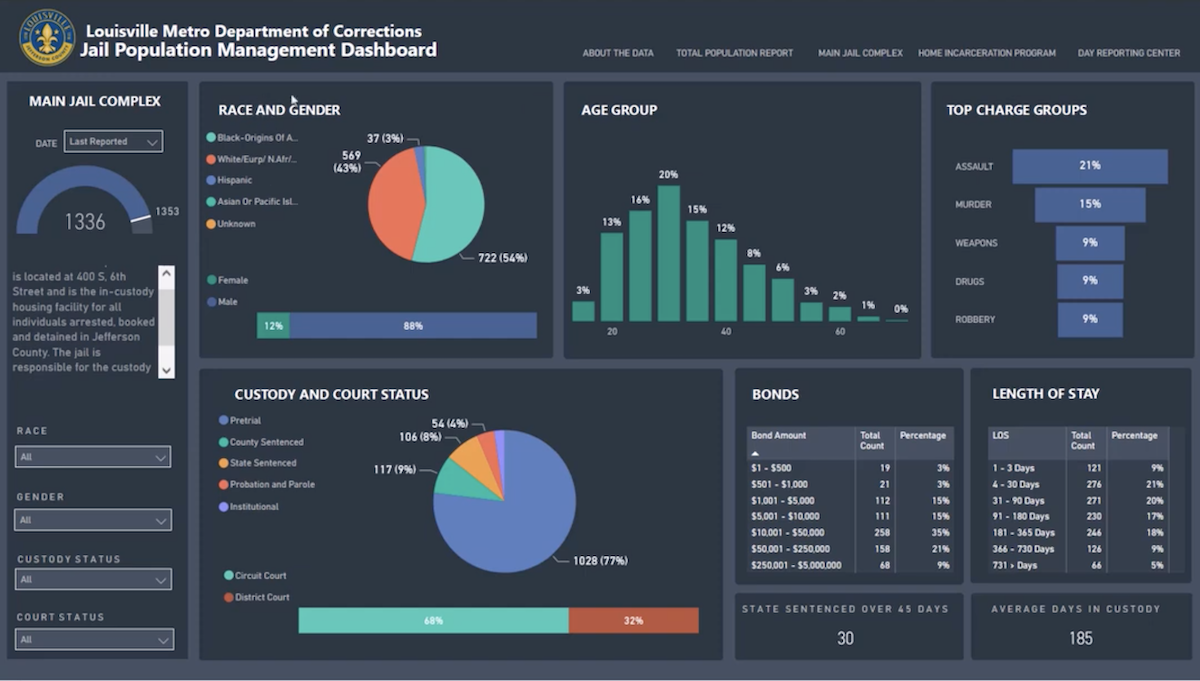
The city’s new Jail Population Dashboard is now live, offering basic statistics about the population of incarcerated people at the Louisville Metro Department of Corrections. LMDC says that it updates the dashboard three times a day.
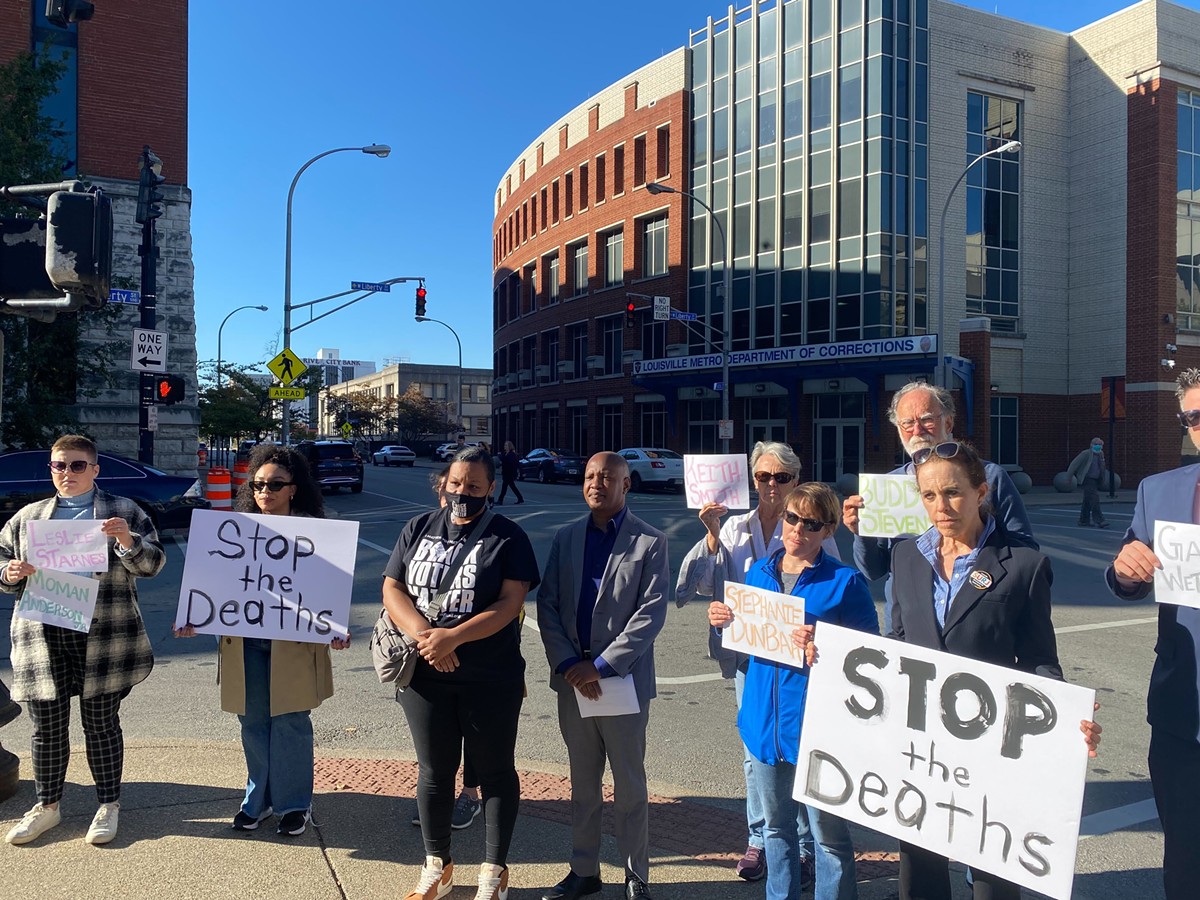
Yet while activists such as the Community Stakeholders to End Deaths at LMDC and other groups feel the dashboard offers better information than they were provided prior to its release, they say that improvements can be made.
In a strong statement released on Monday, May 22, the Community Stakeholders said, “While this new dashboard is a step in the right direction in that it publishes daily population data for public consumption, there is much more the city and LMDC can and must do to more ethically collect, track, utilize and make accessible data about the people for whom they are charged to provide care.”
The statement followed significant concerns expressed to LEO about the dashboard last week.
The dashboard offers general data about the number of people incarcerated in LMDC including race, gender, and court status, but activists claim the dashboard is simply a snapshot of who’s in jail without any context to account for conditions that could result in poor outcomes for individuals. In the statement, the Community Stakeholders said they would like to see different data in the dashboard and better usability. The group would also like to see LMDC hire a data analyst that has experience in the system, either a person who was formerly incarcerated or someone impacted directly by the penal system.
ACLU Policy Strategist and Jail Policy Committee Member Kungu Njuguna works with all the groups involved and understands where the groups are finding problems.
“We are hearing from people who aren’t used to this that it’s not very user-friendly to someone who might be new to this and trying to get the numbers right,” Njuguna told LEO on May 15. He noted that the dashboard is so complicated, its launch included a lengthy video just to explain how it works. “Even the video that they made, I think is nine minutes long,” Njuguna said.
A project that has been at least 15 years in the making, according to those close to it, the dashboard was released at the end of April.
Community Stakeholder member Judi Jennings said she has spent years advocating for the creation and release of the dashboard, but that until the rapid increase in jail deaths, there was little movement on the project.
From November 2021 to January 2023, 13 people died in the custody of LMDC. Before this, the jail averaged about three deaths per year.
“It just clearly wasn't on their priorities [list],” she said of the dashboard. “When the deaths started, I think the stakes started to change.”
In January 2023, LMDC director Jerry Collins told WDRB that the jail was trying to gather more resources for those incarcerated at the jail. “We're bringing a lot of smart people in," he said. "We're collaborating with the community. The health department has been great partners with us and we've got some projects going forward with them on harm reduction."
Like others of its kind, the dashboard offers a snapshot of trends inside the jail and the population within it.
The dashboard offers insights based on several criteria: facility, race, gender, custody status, and court status. “Facility” indicates where an inmate might be housed — in the main jail complex, home incarceration, or in a day reporting facility. “Custody status” gives an indication of whether someone is incarcerated awaiting trial or whether they’ve been sentenced by the state or county, are awaiting a court date in Louisville after being held by another Kentucky jurisdiction, or have been jailed for probation or parole violations. “Court status” indicates whether an inmate is housed on a misdemeanor or a felony.
The distinctions are important because they can show individuals are in the system simply because they cannot pay a bond or are awaiting a trial date for a low-level crime. As the jail has struggled with overcrowding and deaths, metrics like this matter.
In the May 22 statement, the group criticizes the fact that the city does not offer a way to download the data and that the available data is only a small piece of a larger dataset. They claim that limits the public’s ability to work with the data independent of what the city provides, which could impact their ability to hold LMDC accountable for trends or anomalies they notice.
They would like to see the data include release/end of term dates and the reason for incarceration, length of stay by charge type, and the ability to do side-by-side comparison of data, and to know more about medical interventions. They also say the next version of the database should have the capability to communicate with other Louisville departments and systems, and investment in data and analytics infrastructure to provide transparency and accountability for the care and conditions of the incarcerated.
According to Njuguna, the dashboard was in development with the input of several stakeholder groups alongside the Criminal Justice Commission and its Jail Policy Committee. The Policy Committee includes people from the Commonwealth’s Attorney’s office, LMDC, the administrative office of the courts, district court judges, circuit court judges, and about four community groups.
Njuguna noted the broad input, saying, “It was a long process coming, but there is staff on the Jail Policy Committee who worked on it before it was released. They did, before it was released, meet with the LMDC Community Stakeholders group, and they met with the county attorneys who got to test it. The judges got to test it. All the groups got to test it and offered their feedback.”
Yet reviews have been mixed. Despite the information that the dashboard provides, key stakeholders say some things are missing.
“There isn’t a clear way to look at the data beyond simple trend lines and very basic trends in correlation,” Community Stakeholders member Corey Kline Buckman said in an email last week. She works in project management with an analytics and data management software and consulting company unrelated to the dashboard.
“In other words, it is very hard to use this data to dig into anything of substance about what’s happening at LMDC beyond population counts and basic demographic information,” Buckman said.
Rebecca Frederick, who works as the data coordinator for the Louisville Community Bail Fund, uses data to advocate for policy change. She said that the dashboard is an improvement over the former “daily sheet” tallying the jail population that she relied upon, but that it is still difficult to use.
“It is not an accessible tool for the general public. The video is not accessible. None of it,” said Frederick in an email last week.
In the May 22 statement, the group also questions ADA compliance of the dashboard with its color choices and lack of ability to scale or zoom on content, and that open source tools to aid accessibility are unable to identify the database.
The statement also claims that the data in the database seems design to justify incarceration, saying, “The introductory pages and video heavily focus on the rankings of crime, violence, felonies vs. misdemeanors, etc., with the assumed intention to justify why they are incarcerating people in jail with inhumane conditions that are sometimes fatal.”
The group says the dashboard excludes information about incidents reported within the jail or how they relate to the population, “charge group,” demographics, and the length of the jail stay.
The dashboard also doesn’t address any mental health, medical intervention, or potential self-harm activity in the jail, which creates some concern for advocates.
“A specific example is that this dashboard would not help anyone see that there have been 13 deaths at LMDC in less than two years. It would be great if we had discharge/release/end of service information as well,” said Kline Buckman.
Frederick concurred.
“As Corey mentioned, they only give basic data/trends,” she said. “With the 13 deaths came a break in trust between the jail and the larger community. People are scared. This dashboard could have been an opportunity for them to share care-related data to show they are providing adequate care for the people they are legally mandated to care for.” Frederick feels the data presented is curated to justify incarceration in inhumane conditions.
Njuguna also feels the dashboard could have included more.
“There is some information that other people have been calling for that’s not on there,” said Njuguna. “Like how often was Narcan used, how many people were taken to the ER, and to really get at more of the wellness of individuals there. I think that is information that should probably be added to it. It doesn’t violate HIPAA because we’re not talking about individuals, just numbers.”
Njuguna said that now that the dashboard is live, the first goal is met and the Criminal Justice Commission, which developed the dashboard interface, is open to suggestions and may already be working on a second iteration.
The group says they are committed to continuing to work with Jail Director Collins, the mayor’s office, Jail Policy Committee, and other leaders to “advocate for these changes and transform the way” incarcerated individuals are cared for.


